The cryptocurrency market is displaying signs of renewed strength as NEAR Protocol broke through a key resistance level during the final trading hour of July 7. The decisive move came on...
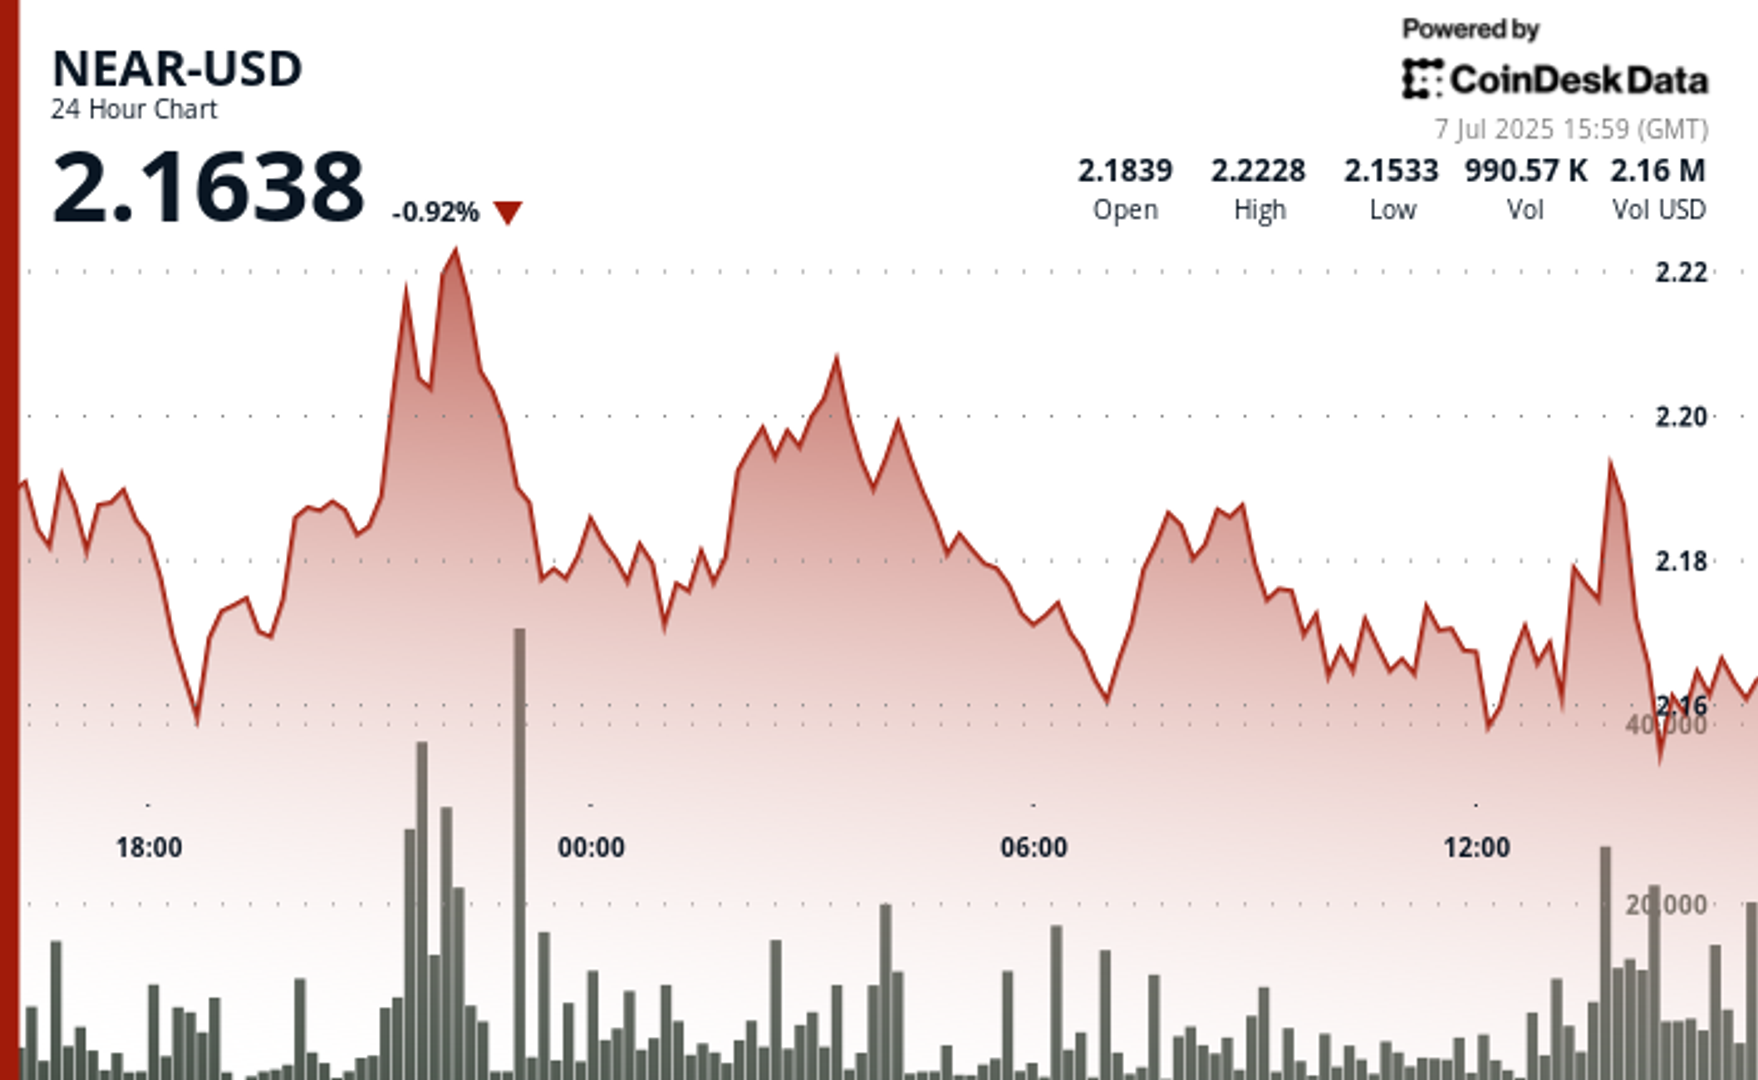
Read moreThe cryptocurrency market is displaying signs of renewed strength as NEAR Protocol broke through a key resistance level during the final trading hour of July 7. The decisive move came on exceptional volume that was 61% higher than the daily average, confirming the validity of the breakout from an ascending triangle pattern that had been forming throughout the day. NEAR-USD established strong support in the $2.16-$2.17 range with multiple bounces before finally overcoming resistance at $2.19-$2.20 during a surge in price. This breakout was particularly notable during a 60-minute period ending at 14:04, when NEAR surged 1.13% from $2.17 to $2.19, forming what analysts describe as a textbook cup and handle pattern.
This positive technical development coincides with significant momentum in the broader crypto market, with Bitcoin surpassing $109K and nearing its all-time high of $111,970. The total cryptocurrency market capitalization has increased to $3.36 trillion on a 40% surge in trading volume, creating favorable conditions for altcoins like NEAR to benefit from improved market sentiment. Despite NEAR’s positive price action, the asset remains below its all-time high of $20.42 reached in January 2022. Current technical indicators present a mixed picture, with 14 green days out of the last 30, but an RSI of 31.09 suggesting oversold conditions that could support further recovery.
Technical analysis for NEAR-USD highlights notable volatility during the 24-hour period from 6 July 15:00 to 7 July 14:00, with a price range of $2.16 to $2.22, representing a 3.15% swing. Key support was established at $2.16-$2.17 with multiple bounces, while resistance at $2.19-$2.20 was eventually overcome during the final hour on exceptional volume. The breakout above the $2.19 level, coupled with the formation of a bullish ascending triangle pattern, indicates potential for continued upward momentum with the next resistance target at $2.22. Support at $2.16 during a mid-period pullback held firmly, with buyers stepping in aggressively to fuel the subsequent rally that peaked at $2.19.
The CD20 index also experienced significant volatility over the same 24-hour period, with a notable 1.17% price range between the high and low points. After reaching a peak during the early hours of July 7, the market entered a consolidation phase before stabilizing towards the end of the period.
Please note that parts of this article were generated with the assistance of AI tools and reviewed by our editorial team to ensure accuracy and adherence to our standards.
- [posts_like_dislike id=1307]