E-mini Nasdaq-100 (NDX) futures saw a more than 1% increase on Tuesday, coming close to the record high of $22,425 reached on December 17. This uptrend could be encouraging for bitcoin...
Read moreMoving Average
Moving Average
Ether (ETH) saw a slight recovery over the weekend following a turbulent week characterized by significant institutional outflows. On Friday, June 20, U.S.-listed spot ETH ETFs experienced net outflows of $11.3...
Read moreEther (ETH) saw a slight recovery over the weekend following a turbulent week characterized by significant institutional outflows. On Friday, June 20, U.S.-listed spot ETH ETFs experienced net outflows of $11.3 million, marking the largest single-day decline in June, according to data from Farside Investors.
The majority of the pullback was led by BlackRock’s ETHA ETF, which recorded an outflow of $19.7 million — its only negative flow for the month. In contrast, Grayscale’s ETHE product attracted $6.6 million, while VanEck’s ETHV ETF added $1.8 million, partially offsetting the overall losses. No other issuers reported inflows or outflows.
This data suggests that larger institutions may be cutting back on their exposure to ETH, despite some funds like Grayscale continuing to draw in capital.
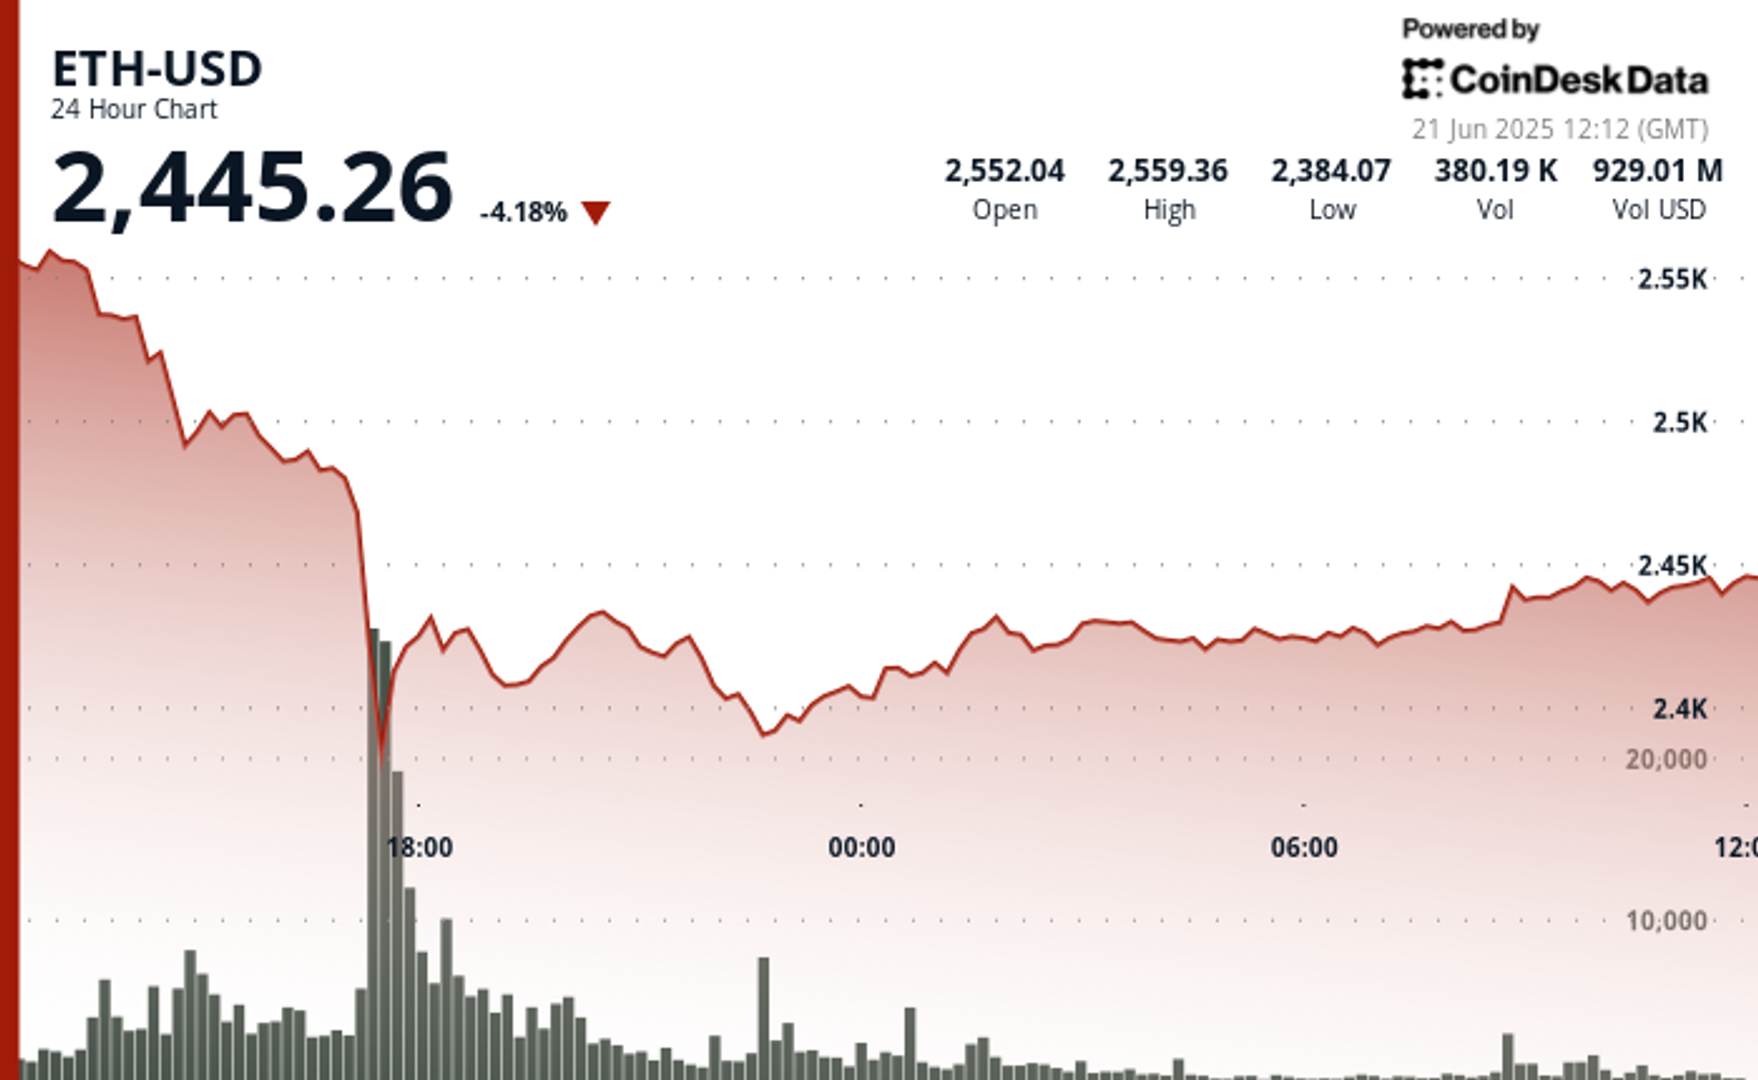
Alongside these ETF flow figures, there was a technical rebound in the price of Ether. Although ETH briefly dropped to $2,372.85 on Friday during a heavy sell-off with significantly increased volume, buyers quickly stepped in around the $2,420–$2,430 range. This area has now become a strong support zone, validated by multiple low-volume tests indicating accumulation.
The 24-hour trading volume surged 18.97% above the 7-day moving average, reflecting heightened trading interest during the price recovery. ETH closed near $2,445 and formed an ascending trendline of higher lows, with key resistance levels remaining at $2,480–$2,500.
In terms of technical analysis highlights:
– ETH-USD had a 24-hour trading range of $186.44 (7.25%), with a low of $2,372.85 during a sharp sell-off.
– The drop occurred during the 17:00 hour and was accompanied by a substantial increase in trading volume.
– A key support zone between $2,420 and $2,430 has been established, with successful retests and lower sell-side volume.
– ETH reclaimed 38.2% of the Fibonacci retracement and formed an ascending trendline supported by higher lows.
– Volume accelerated during the 08:00–09:00 hour, signaling bullish momentum.
– The price closed near $2,445, with a late-session rally peaking at $2,447.02.
– Immediate support was found at $2,439.38, maintaining respect for the ascending short-term trendline.
Please note that parts of this article were generated with the assistance of AI tools and reviewed by our editorial team to ensure accuracy and adherence to our standards. For more information, refer to our full AI Policy.
- [posts_like_dislike id=1219]
Dogecoin is currently stabilizing around $0.170 following a sharp rebound from its lows, indicating signs of accumulation amidst global economic uncertainties. The meme cryptocurrency received strong support at $0.16 and is...
Read moreDogecoin is currently stabilizing around $0.170 following a sharp rebound from its lows, indicating signs of accumulation amidst global economic uncertainties. The meme cryptocurrency received strong support at $0.16 and is now consolidating within a symmetrical triangle pattern, which typically foreshadows significant price movements.
In terms of recent news, analysts are closely monitoring Dogecoin’s tightening technical structure. The symmetrical triangle formation, accompanied by decreasing volume and volatility, suggests that a breakout could be on the horizon. Past instances of this pattern have resulted in a potential 60% price swing, although the direction is still uncertain. Given the impending Federal Reserve policy announcement and ongoing market volatility, Dogecoin’s proximity to a breakout point presents both opportunities and risks for traders anticipating a resolution.
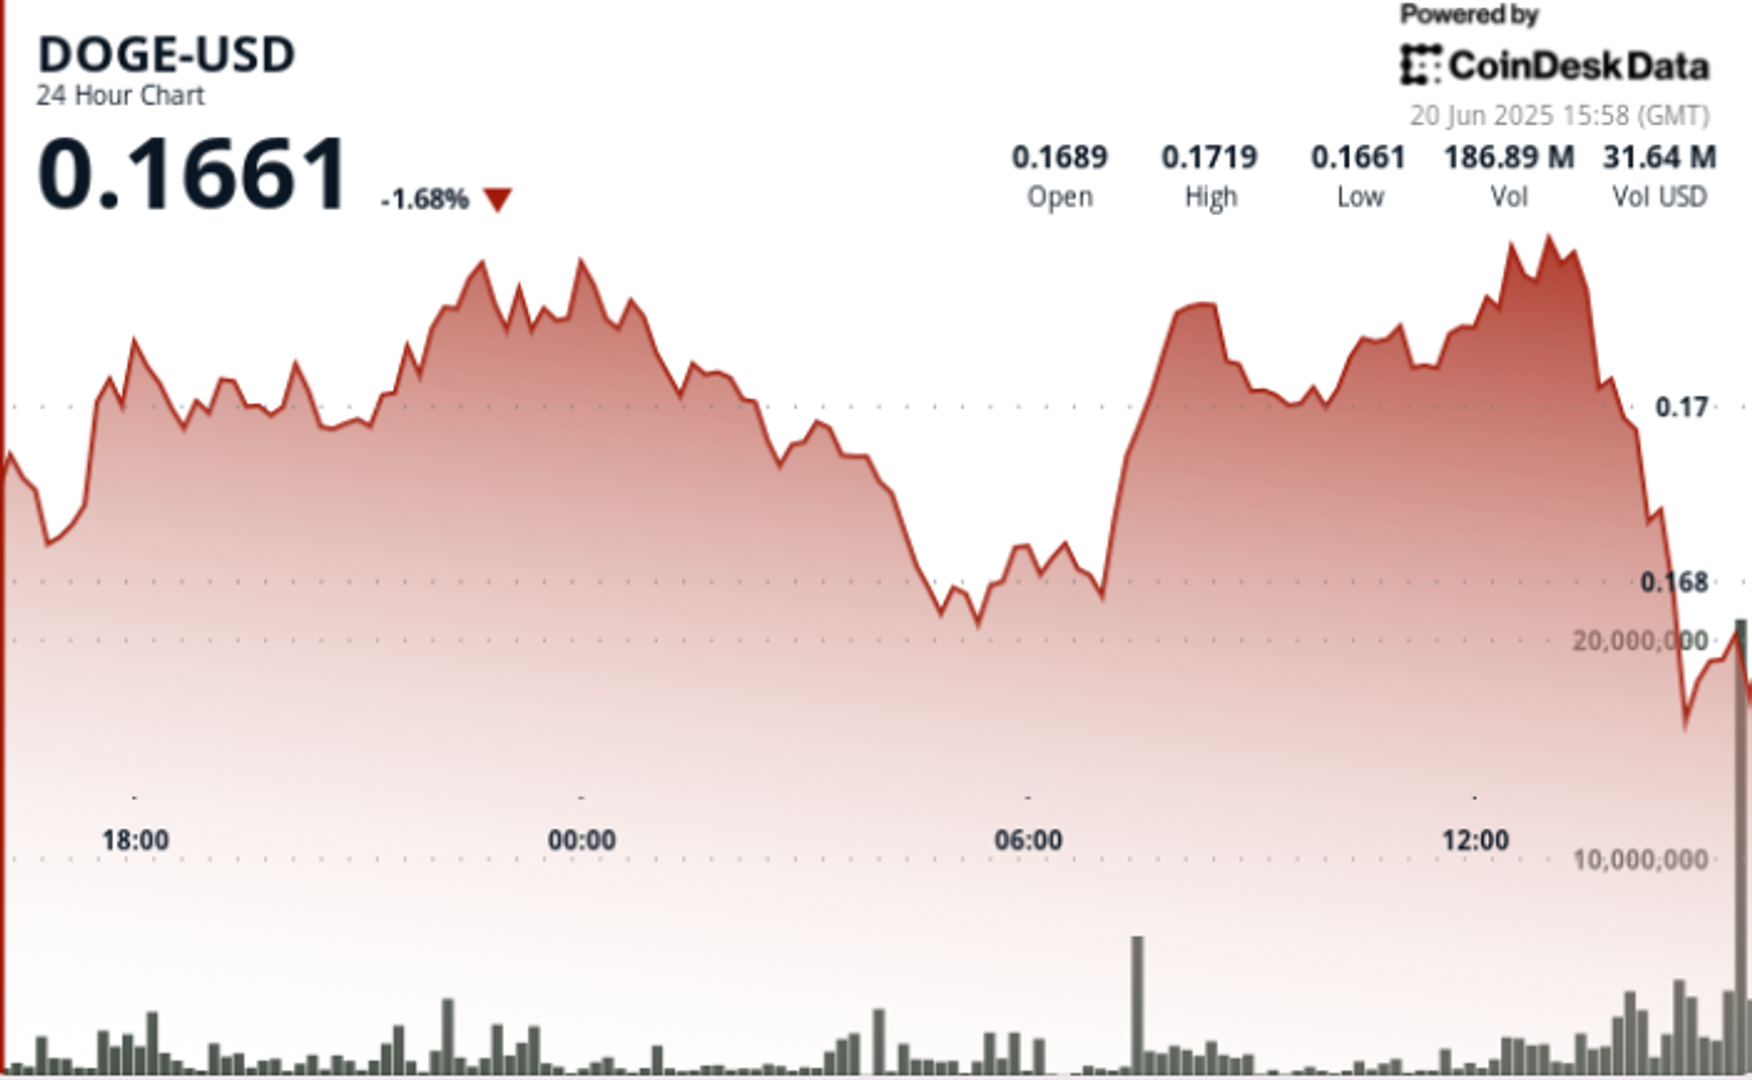
In the past 24 hours, Dogecoin saw trading within a narrow 2.7% range, fluctuating between $0.167 and $0.172. Notably, there was a notable 1.8% decline early in the session followed by a strong recovery with high trading volume at $0.168, now confirmed as a key support level. Despite attempts to breach the resistance at $0.172, they were met with selling pressure around the 13:00 hour, leading to a consolidation phase between $0.170 and $0.172. The late-session dip experienced a surge in trading volume but the price held steady at $0.170.
From a technical analysis standpoint, Dogecoin exhibited a range of 2.7% over the past day, with key support established at $0.168. The symmetrical triangle pattern is tightening, hinting at a potential breakout with a projected 60% price movement. The Relative Strength Index (RSI) remains around 50, while the Moving Average Convergence Divergence (MACD) indicator is flattening, indicating a compression phase in momentum.
- [posts_like_dislike id=1215]
Tags:ADAAIAmericaBinancebitcoinbtcCanadaCoinbaseCryptoDonald TrumpdubaiETHEUFinancegoldGovernmentHealthIranJapanminerMoving AverageS&P 500StocksStrategyTradingtrillionTrumpUSWashington
By Francisco Rodrigues (All times ET unless indicated otherwise) Bitcoin BTC surpassed Wednesday’s record to reach an all-time high of $111,875 in the early hours of Thursday, as traditional financial markets...
Read moreBy Francisco Rodrigues (All times ET unless indicated otherwise)
Bitcoin BTC surpassed Wednesday’s record to reach an all-time high of $111,875 in the early hours of Thursday, as traditional financial markets contended with rising bond yields and renewed concerns over ballooning U.S. debt.
The largest cryptocurrency has gained around 3.8% in the last 24 hours while the broader CoinDesk 20 CD20 index rose 4.74%, continuing a trend of strength driven by mounting institutional demand and growing interest in crypto exposure.
The rally is unfolding against a backdrop of higher yields on U.S. and Japanese government bonds. The 10-year U.S. Treasury yield rose to 4.6%, while the 30-year topped 5%, driven by concerns over President Donald Trump’s tax bill that analysts estimate could add as much as $5 trillion to the country’s debt, according to Reuters.
In Japan, yields on 30- and 40-year government bonds also hit record highs. The country’s debt-to-GDP ratio stands at 234%, QCP Capital said, and growing scrutiny coupled with weak demand for long-dated JGBs sent yields soaring.
That matters because higher yields — and thus higher returns — on investments that are considered relatively safe tend to lower the appeal of riskier assets like stocks, not to mention cryptocurrencies. While BTC, with its history of trading as a risky asset, hasn’t shown much sign of ebbing demand, it raises the question of how long the rally can continue.
Still, traders have been building large long positions in BTC options, with the most open interest now concentrated at the $110,000, $120,000 and even $300,000 calls for contracts expiring in late June in a sign of continuing bullish conviction.
U.S.-traded spot bitcoin exchange-traded funds have also been seeing significant demand. Total net inflows hit $1.6 billion over the week, and $4.24 billion so far in May, SoSoValue data shows. The inflows, coupled with bitcoin’s price rise, have seen the ETFs’ total net assets hit a record $129 billion.
There are, however, some muted signs of bearish activity.
“The largest block flow this week continues to be ETH December call spreads, while overnight BTC butterfly positions hint that some traders are positioning for consolidation around current levels,” Wintermute OTC trader Jake O. said.
Note, he’s talking about consolidation, not declines. And traditional participants may even be too bearish. While the U.S. endured a recent credit downgrade, markets are now pricing in a 6-level cut all the way down to BBB+.
On top of that, per Jake O., a recent equities market sell-off may not be a result of repositioning given higher bond yields, but rather profit-taking after nine consecutive positive sessions. Stay alert!
What to Watch
Crypto
May 22: Bitcoin Pizza Day.
May 22: Top 220 TRUMP token holders will attend a gala dinner hosted by the U.S. president at the Trump National Golf Club in Washington.
May 30: The second round of FTX repayments starts.
May 31 (TBC): Mezo mainnet launch.
Macro
Day 3 of 3: Canadian Finance Minister François-Philippe Champagne and Bank of Canada Governor Tiff Macklem will co-host the three-day meeting of G7 finance ministers and central bank governors in Banff, Alberta.
May 22, 8 a.m.: Mexico’s National Institute of Statistics and Geography releases (final) Q1 GDP growth data.
May 22, 8:30 a.m.: Statistics Canada releases April producer price inflation data.
May 22, 8:30 a.m.: The U.S. Department of Labor releases unemployment insurance data for the week ended May 17.
May 23, 8:30 a.m.: Statistics Canada releases (Final) March retail sales data.
May 23, 10 a.m.: The U.S. Census Bureau releases April new single-family homes data.
Earnings (Estimates based on FactSet data)
May 28: NVIDIA (NVDA), post-market, $0.88
Token Events
Governance votes & calls
Arbitrum DAO is voting on launching “The Watchdog,” a 400,000-ARB bounty program to reward community sleuths for uncovering misuse of the hundreds of millions in grants, incentives and service budgets the DAO has deployed. Voting ends May 23.
Lido DAO is voting on adopting Dual Governance (LIP-28), a protocol upgrade that inserts a dynamic timelock between DAO decisions and execution so stETH holders can escrow tokens to pause proposals at 1% of TVL or fully block and “rage-quit” at 10%. Voting ends May 28.
Arbitrum DAO is voting on a constitutional AIP to upgrade Arbitrum One and Arbitrum Nova to ArbOS 40 “Callisto,” bringing them in line with Ethereum’s May 7 Pectra upgrade. The proposal schedules activation for June 17, and voting ends on May 29.
May 22: Official Trump to announce its “next Era” on the day of the dinner for its largest holders.
June 10: Ether.fi to host an analyst call followed by a Q&A session.
Unlocks
May 31: Optimism (OP) to unlock 1.89% of its circulating supply worth $24.67 million.
June 1: Sui (SUI) to unlock 1.32% of its circulating supply worth $182.58 million.
June 1: ZetaChain (ZETA) to unlock 5.34% of its circulating supply worth $11.99 million.
June 12: Ethena (ENA) to unlock 0.7% of its circulating supply worth $16.78 million.
June 12: Aptos (APT) to unlock 1.79% of its circulating supply worth $61.86 million.
Token Launches
June 1: Staking rewards for staking ERC-20 OM on MANTRA Finance end.
June 16: Advised deadline to unstake stMATIC as part of Lido on Polygon’s sunsetting process ends.
Conferences
Day 3 of 7: Dutch Blockchain Week (Amsterdam)
Day 3 of 3: Avalanche Summit London
Day 3 of 3: Seamless Middle East Fintech 2025 (Dubai)
Day 2 of 2: Crypto Expo Dubai
Day 2 of 2: Cryptoverse Conference (Warsaw)
May 27-29: Bitcoin 2025 (Las Vegas)
May 27-30: Web Summit Vancouver
May 29: Stablecon (New York)
May 29-30: Litecoin Summit 2025 (Las Vegas)
May 29-June 1: Balkans Crypto 2025 (Tirana, Albania)
June 2-7: SXSW London
June 15-17: G7 2025 Summit (Kananaskis, Alberta, Canada)
June 19-21: BTC Prague 2025
Token Talk
By Shaurya Malwa
The HYPE token is in focus after a billion-dollar bitcoin trade boosted Hyperliquid’s fundamentals.
Pseudonymous trader James Wynn opened a $1.1 billion long on BTC using 40x leverage via Hyperliquid in one of the largest on-chain DEX trades ever recorded.
The position, tied to wallet “0x507,” was entered when BTC was priced at $108K and now sits on over $40 million in unrealized profit.
Wynn booked partial profits early Thursday by closing 540 BTC (~$60 million), to net $1.5 million.
His prior exits were followed by BTC declines, so traders are watching closely.
Hyperliquid runs on its custom L1, HyperEVM, using the HyperBFT consensus (200K+ TPS) with CEX-level features like real-time order books and deep liquidity — no KYC required.
The platform’s permissionless design and lightning-fast execution are increasingly drawing capital from centralized venues to DeFi , and this trade could set a precedent for whale activity.
HYPE jumped 15% in the past 24 hours on renewed attention and usage-driven speculation.
Derivatives Positioning
Analyzing the liquidations heatmap of the BTC-USDT pair on Binance, the largest liquidations cluster around $108.5K and $106.9K with liquidations worth $143 million and $112.5 million, respectively.
Meanwhile, the options market swells post-breakout, with open interest on Deribit climbing above $34 billion, just shy of the all-time high of $35.9 billion set in December. The bulk of this positioning is centered on the 30 May expiry, which now holds over $9 billion in notional value to become a key date for potential volatility.
Bullish sentiment is clearly in control, with traders aggressively targeting upside via calls. Strikes at $100K, $120K and $150K have attracted particularly large open interest, reflecting growing conviction in a continued rally.
Put/call ratios underscore this shift in sentiment — the 24-hour volume ratio has dropped to 0.49, while the open interest ratio sits at 0.60, indicating a meaningful tilt toward bullish exposure following BTC’s move above $110K.
Near-term options activity is also picking up, with weekly and monthly contracts seeing notable inflows. Traders appear to be positioning for further momentum or short-term price swings in the wake of the breakout.
Market Movements
BTC is up 1.19% from 4 p.m. ET Wednesday at $110,690.36 (24hrs: +4.05%)
ETH is up 6.19% at $2,662.72 (24hrs: +5.23%)
CoinDesk 20 is up 3.64% at 3,348.63 (24hrs: +4.88%)
Ether CESR Composite Staking Rate is unchanged at 3.03%
BTC funding rate is at 0.03% (10.95% annualized) on Binance
DXY is up 0.25% at 99.81
Gold is down 0.26% at $3,305.6/oz
Silver is down 0.83% at $33.17/oz
Nikkei 225 closed -0.84% at 36,985.87
Hang Seng closed -1.19% at 23,544.31
FTSE is down 0.68% at 8,726.62
Euro Stoxx 50 is down 0.96% at 5,402.31
DJIA closed on Wednesday -0.91% at 41,860.44
S&P 500 closed -1.61% at 5,844.61
Nasdaq closed -1.41% at 18,872.64
S&P/TSX Composite Index closed -0.83% at 25,839.17
S&P 40 Latin America closed -1.31% at 2,597.38
U.S. 10-year Treasury rate is down 2 bps at 4.58%
E-mini S&P 500 futures are unchanged at 5,865.50
E-mini Nasdaq-100 futures are up 0.15% at 21,188.50
E-mini Dow Jones Industrial Average Index futures are down 0.17% at 41,875.00
Bitcoin Stats:
BTC Dominance: 63.90 (-0.62%)
Ethereum to bitcoin ratio: 0.02409 (3.52%)
Hashrate (seven-day moving average): 875 EH/s
Hashprice (spot): $58.24
Total Fees: 7.89 BTC / $847,124
CME Futures Open Interest: 160,740 BTC
BTC priced in gold: 33.4 oz
BTC vs gold market cap: 9.47%
Technical Analysis
Bitcoin reached a new all-time high of $111,875 this morning, breaking decisively above the previous peak just above $109,000 set in January.
With a confirmed close above that level and no sign of a swing failure pattern, the bias remains firmly tilted toward continued upside. In the near term, BTC may encounter resistance around the $112,000–$113,000 range, aligning with a trendline drawn from the prior highs in December and January.
However, last week’s consolidation above $100,000 — and the successful reclaim of the previous all-time high — suggest this area is now acting as short-term support.
A pullback below $100,000, especially into the weekly order block, would likely represent a healthy correction within the broader uptrend and could offer a compelling reentry opportunity if further downside is seen.
Crypto Equities
Strategy (MSTR): closed on Wednesday at $402.69 (-3.41%), up 1.73% at $409.67 in pre-market
Coinbase Global (COIN): closed at $258.99 (-0.91%), up 2.78% at $266.20
Galaxy Digital Holdings (GLXY): closed at C$31 (+1.57%)
MARA Holdings (MARA): closed at $15.84 (-2.16%), up 4.42% at $16.54
Riot Platforms (RIOT): closed at $8.84 (-1.01%), up 3.39% at $9.14
Core Scientific (CORZ): closed at $10.78 (-1.28%), up 1.48% at $10.94
CleanSpark (CLSK): closed at $10.11 (+4.23%), up 4.65% at $10.58
CoinShares Valkyrie Bitcoin Miners ETF (WGMI): closed at $17.75 (-1.33%)
Semler Scientific (SMLR): closed at $44.89 (+7.19%), up 6.01% at $47.59
Exodus Movement (EXOD): closed at $32.76 (-5.07%), unchanged in pre-market
ETF Flows
Spot BTC ETFs:
Daily net flow: $607.1 million
Cumulative net flows: $43.35 billion
Total BTC holdings ~ 1.19 million
Spot ETH ETFs
Daily net flow: $0.6 million
Cumulative net flows: $2.61 billion
Total ETH holdings ~ 3.49 million
Source: Farside Investors
Overnight Flows
Chart of the Day
Top 20 digital assets’ prices and volumes
Chart of the day
Bitcoin adoption
- [posts_like_dislike id=1033]
Geopolitical tensions and evolving trade policies are continuing to impact cryptocurrency markets, with Dogecoin demonstrating resilience amidst broader economic uncertainty. Despite macroeconomic challenges, Dogecoin (DOGE) has managed to maintain support above...
Read moreGeopolitical tensions and evolving trade policies are continuing to impact cryptocurrency markets, with Dogecoin demonstrating resilience amidst broader economic uncertainty. Despite macroeconomic challenges, Dogecoin (DOGE) has managed to maintain support above key moving averages. It is also forming a potential bull flag pattern that could target $0.35 if there is sustained buying pressure.
Here are some technical analysis highlights for DOGE:
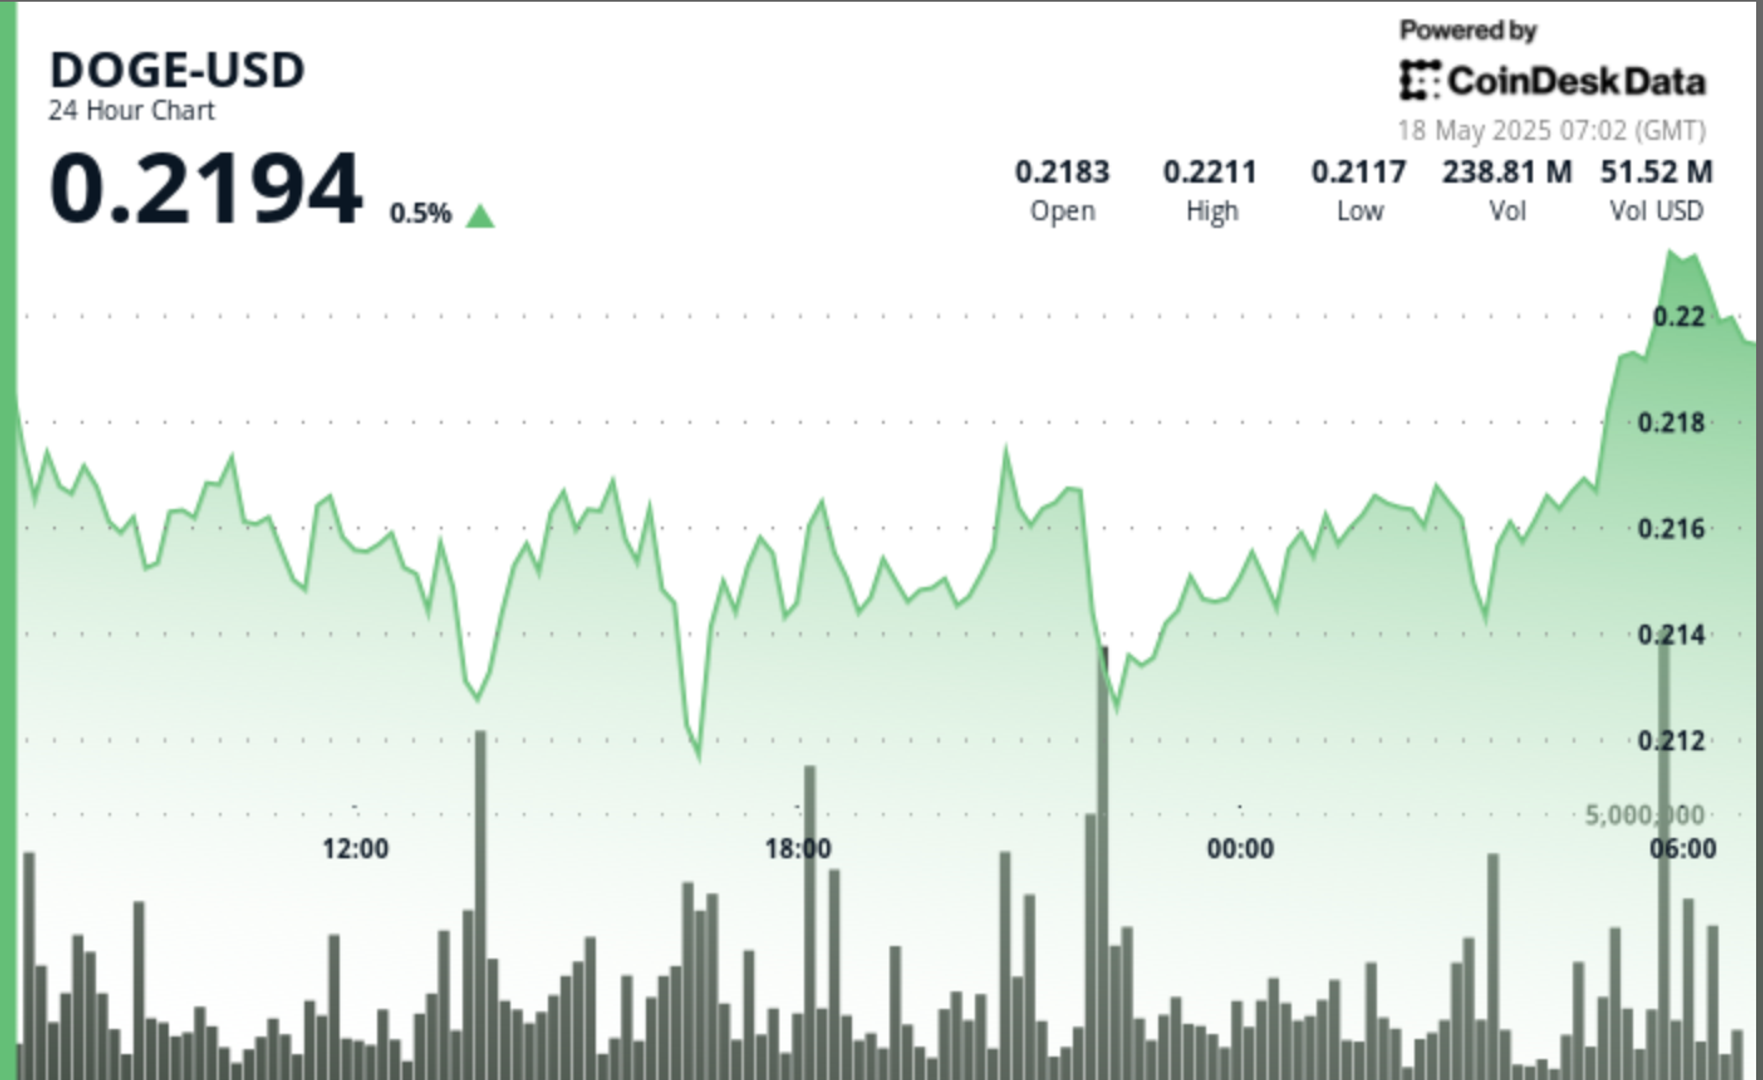
– DOGE has experienced significant volatility, with a 4.3% range (0.211-0.220) over the past 24 hours. There is a key support zone around 0.212, confirmed by high volume rebounds at 13:00 and 22:00.
– The price action shows a bullish recovery pattern from the 16:00 low, with resistance levels between 0.217-0.220.
– A strong volume surge above the 24-hour average at 20:00 indicates renewed buying interest. This suggests potential upward momentum if DOGE can maintain its position above the established support level.
– Recent hours have seen significant bullish momentum for DOGE, with notable volume spikes at various times.
– The uptrend continued with higher lows forming an ascending pattern, leading to a new resistance test at the 0.216-0.217 range.
– Heavy trading activity in the final minutes further confirms strong buyer interest and hints at potential for further upside movement.
Please note that this article was created with AI tools and reviewed by our editorial team for accuracy and adherence to our standards. For more information, you can view CoinDesk’s full AI Policy. Additionally, external references used in this article are listed below for further reading:
– “Dogecoin Eyes $0.35 as Whale Accumulation Signals Bull Flag Breakout” by The Crypto Basic
– “Dogecoin Hovers at $0.22 Following Weeks of Gains, Analysts Share Mixed Outlooks” by NewsBTC
- [posts_like_dislike id=1011]
XRP saw a decrease of over 4% in the last 24 hours, leading the decline among major cryptocurrencies as the overall market slows down following last week’s significant rally. Bitcoin is...
Read moreXRP saw a decrease of over 4% in the last 24 hours, leading the decline among major cryptocurrencies as the overall market slows down following last week’s significant rally. Bitcoin is currently above $104,000, and traders are anticipating a steady increase beyond $105,000, which is now a key psychological and technical resistance level.
The total market capitalization of the crypto market dropped by 2% to $3.3 trillion, according to CoinGecko. Ethereum (ETH) and Solana (SOL) are also pausing near their 200-day moving averages, indicating a possible period of consolidation or a short-term pullback.
Alex Kuptsikevich, FxPro’s chief market analyst, noted that Bitcoin has been gradually forming a peak over the past week, usually a sign that a correction is imminent. The Crypto Fear & Greed Index slightly decreased from 73 to 70, remaining in the “greed” territory but showing a decrease in momentum.
According to Augustine Fan from SignalPlus, the markets may continue to edge higher unless equities experience a downturn. He warned that Bitcoin may face challenges breaking through the interim resistance at $105,000, while Ethereum could benefit more in the short term due to improving inflows and strong performance in altcoins.
Fan also highlighted a significant shift in capital allocation towards crypto, describing it as a more structural move favoring assets like emerging markets, precious metals, and cryptocurrencies to hedge against geopolitical and currency risks.
K33 Research observed that Bitcoin’s recent surge seems to be driven by spot market demand rather than excessive leverage, with retail investors and wealth managers from Asia contributing to sustaining the bullish sentiment. Nick Ruck from LVRG Research mentioned that the market slowdown may be due to caution ahead of upcoming macroeconomic data and concerns about the long-term effects of recent U.S. trade agreements.
The current market situation indicates a wait-and-see approach just below critical breakout levels, with the next significant move expected to dictate the overall market direction.
- [posts_like_dislike id=995]
This is a daily technical analysis by our analyst and Chartered Market Technician, Omkar Godbole. Picture two major newspapers both supporting the same presidential candidate. This joint endorsement suggests that the...
Read moreThis is a daily technical analysis by our analyst and Chartered Market Technician, Omkar Godbole.
Picture two major newspapers both supporting the same presidential candidate. This joint endorsement suggests that the candidate likely has widespread backing.
In a similar vein, when the price charts for both bitcoin (BTC) and MicroStrategy (MSTR) – the largest publicly-listed BTC holder – display simultaneous bullish signals, it indicates a strong alignment between the market and major institutional players.
On the daily price charts for both BTC and MSTR, their 50-day simple moving averages (SMA) have crossed above their 100-day SMA, confirming a bullish crossover. This reveals that the short-term trend is currently surpassing the longer-term trend, potentially signaling the start of a significant bull market.
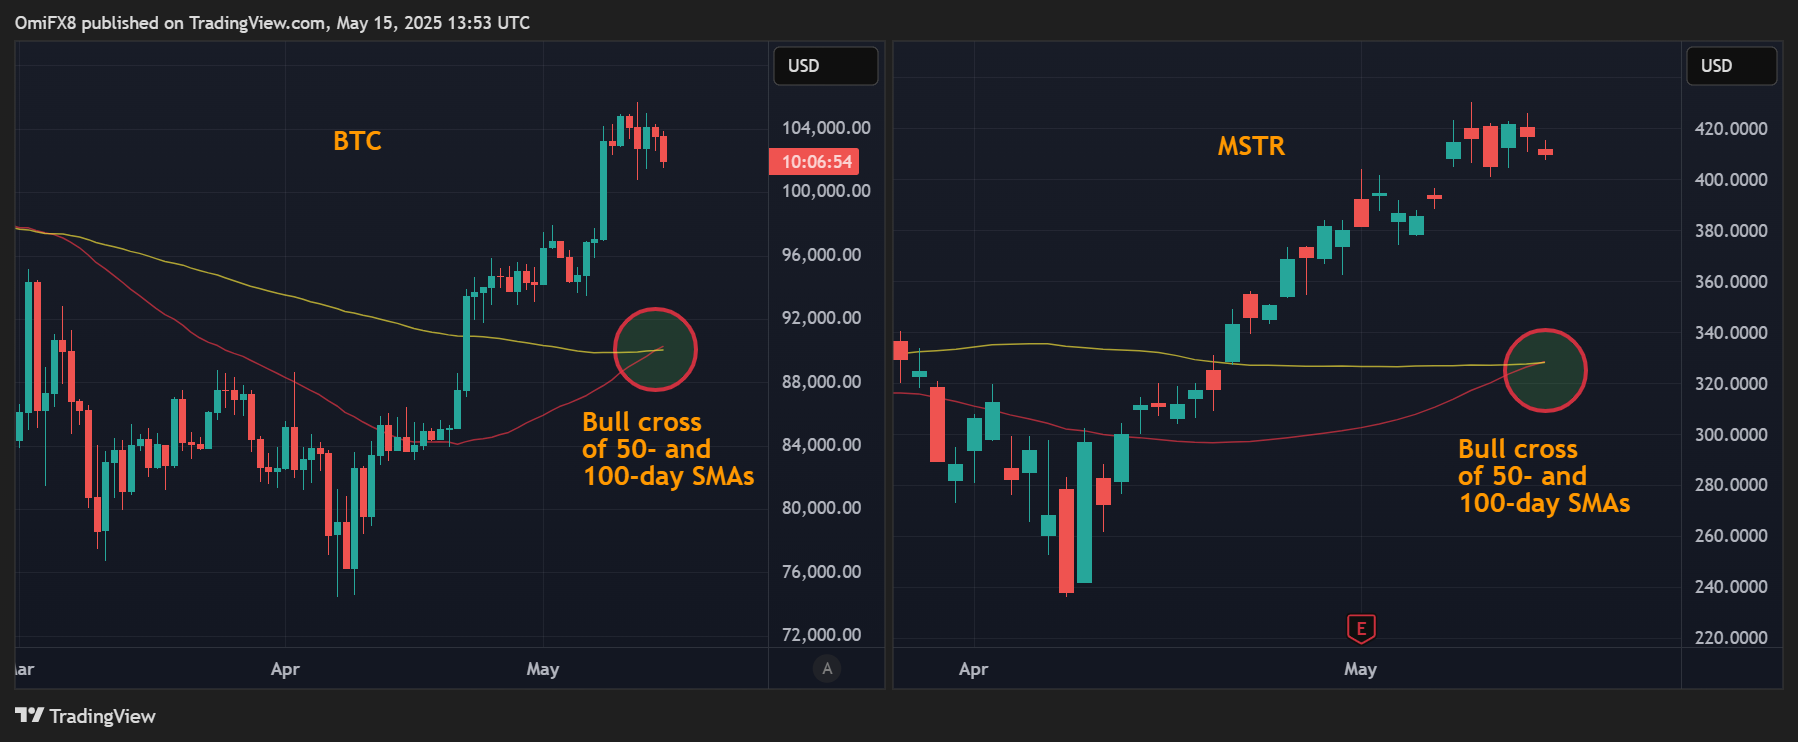
The bullish crossover in BTC is supported by other indicators like the MACD, indicating that the path of least resistance is upwards.
However, it’s important to note that a temporary drop below $100,000 cannot be discounted, as on-chain data suggests that influential market participants are exercising caution.

The chart indicates that BTC’s price rally has come to a halt within the $101,000-$107,000 range. A breakdown below this range could trigger more profit-taking, potentially leading to a deeper pullback in the bull market towards support at $98,000.
- [posts_like_dislike id=991]
This is a daily technical analysis by our analyst and Chartered Market Technician, Omkar Godbole. Crypto bears should keep a close eye on bitcoin’s recent chart patterns, which resemble those that...
Read moreThis is a daily technical analysis by our analyst and Chartered Market Technician, Omkar Godbole.
Crypto bears should keep a close eye on bitcoin’s recent chart patterns, which resemble those that preceded the late 2024 rally from $70,000 to $109,000.
The first pattern to watch is the weekly chart’s Moving Average Convergence Divergence (MACD) histogram, which is used to identify trend changes and reversals. MACD crossovers above or below the zero line typically signal bullish or bearish shifts in momentum.
Traders should interpret these signals in context with price action. For example, a bearish crossover should be confirmed by weakening prices; otherwise, it could be a bear trap indicating underlying strength. Currently, BTC seems to be in this scenario.
The cryptocurrency initially dropped after the MACD turned negative in mid-February, but it quickly found support at the 50-week simple moving average (SMA) in March and has since bounced back above $90,000. Throughout this period, the MACD has remained below zero.
This pattern resembles last August and September when prices held the SMA support despite persistent bearish MACD signals. The indicator turned bullish around mid-October, confirming the trend and leading to a rally from $70,000 to $100,000 by December.
The second pattern to note involves the 50- and 200-day SMAs. About four weeks ago, these averages formed a bearish crossover known as the death cross, indicating a potential long-term downtrend. However, this turned out to be a bear trap as bitcoin found support around $75,000 and changed direction.
Recently, the 50-day SMA has started to rise and could soon cross above the 200-day SMA, potentially setting up a bullish golden cross in the coming weeks.
This pattern closely resembles last year’s trend: the death cross in August marked a bottom, quickly followed by a golden cross that triggered a breakout above $70,000 and eventually led to a rally above $109,000 to new highs.
In summary, bullish volatility may be on the horizon, possibly propelling bitcoin well beyond the January high of $109,000.
While chart patterns are commonly used to evaluate market strength and predict future movements, it’s essential to remember that history does not always repeat itself, and macroeconomic factors can quickly change market directions, making chart analysis less than foolproof.
- [posts_like_dislike id=943]
Tags:AIAmericabitcoinbtcCoinbaseCryptoDonald TrumpdubaiETHEUgoldMoving AverageS&P 500solanaTariffsTradingTrumpUSXRP
By Parrot Press Staff President Donald Trump’s recent announcement of “reciprocal tariffs” this month has caused economic trade policy uncertainty to reach an all-time high. This has led investors to shy...
Read moreBy Parrot Press Staff
President Donald Trump’s recent announcement of “reciprocal tariffs” this month has caused economic trade policy uncertainty to reach an all-time high. This has led investors to shy away from risk assets, such as bitcoin (BTC) and other cryptocurrencies.
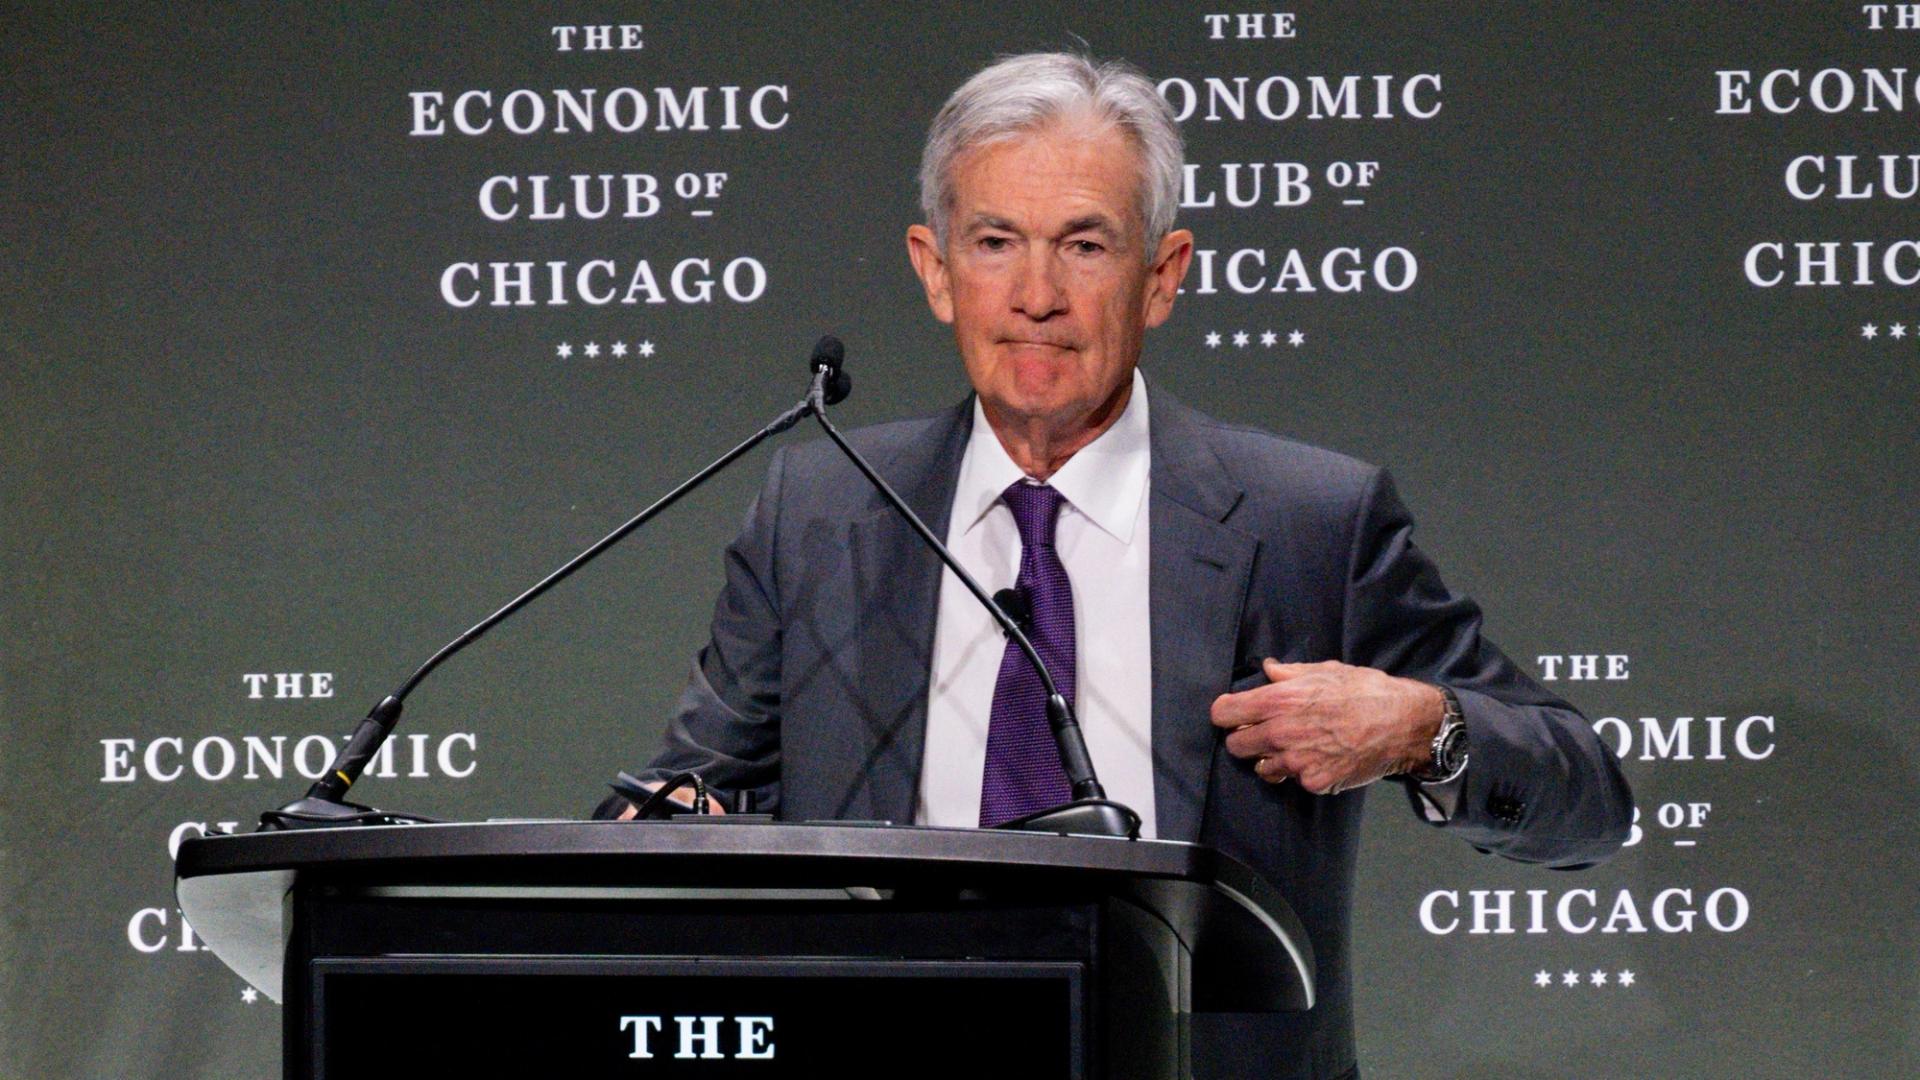
Federal Reserve Chairman Jerome Powell added fuel to the fire by stating late Wednesday that the central bank anticipates a rise in unemployment as the economy is likely to slow down and inflation is expected to increase. Powell mentioned that some of the tariffs imposed are likely to be paid by the public, further weighing on risk assets. This resulted in the Nasdaq dropping 1.17% and the S&P 500 decreasing by 2.24% before the closing bell. Despite this, bitcoin saw an increase of more than 1% in the past 24 hours. The CoinDesk 20 (CD20) index, which provides a broader market perspective, also saw a rise of 1.8%. However, the crypto market is more considered a gauge of risk rather than a safe haven, as reported by Coindesk.
According to Michael Brown, an analyst at Pepperstone, there is likely to be a growing demand for “assets which provide shelter from political incoherence and trade uncertainty,” as reported by The Telegraph. While bitcoin has outperformed the stock market, showing a 1% increase in the past month compared to the Nasdaq’s 8% drop, institutional investors are turning to gold as a safe haven investment.
Gold has seen an 11% increase over the last month and a 27% increase since the beginning of the year, reaching around $3,340 per troy ounce. A survey conducted by Bank of America’s Global Fund Manager revealed that 49% of fund managers view “long gold” as the most crowded trade on Wall Street, with 42% of them predicting it to be the best-performing asset of the year.
UBS analysts suggested that adding gold allocations has become more compelling due to the escalating tariff uncertainty, weaker growth, higher inflation, geopolitical risks, and diversification away from US assets and the US dollar, as reported by Investopedia.
Gold fund flows have reached $80 billion so far this year, while data from SoSoValue indicates that spot bitcoin ETFs have seen $5.25 billion net inflows in January, with net outflows occurring since the rise in uncertainty. In the month of April alone, over $900 million has exited these funds, following net outflows of $3.56 billion in February and $767 million in March. It is advised to stay alert in such an uncertain market environment.
In the latest Token Events updates, EigenLayer is implementing slashing on Ethereum mainnet, Pepecoin is undergoing its second halving, BNB Chain will be undergoing the opBNB mainnet hardfork, and Coinbase Derivatives will be listing XRP futures pending approval by the U.S. Commodity Futures Trading Commission.
Various conferences and events, such as CoinDesk’s Consensus in Toronto on May 14-16, NexTech Week Tokyo, Money20/20 Asia in Bangkok, Crypto Horizons 2025 in Dubai, and many more are scheduled to take place in the upcoming days.
In other news, Raydium’s LaunchLab platform has gone live, competing with Pump.fun and introducing a perceived competing platform to the Solana ecosystem. This has led to over 1,750 tokens being created shortly after LaunchLab’s debut, driving the price of Raydium’s RAY token up by as much as 10%.
On the technical analysis front, Bitcoin has rebounded off the golden pocket zone, showing strong buyer interest. It has broken out of the daily downtrend that has been in place since February, indicating a potential shift in structure. BTC is currently sitting below the daily 50 and 200 exponential moving averages, which act as important decision points for the price direction.
Overall, the market is seeing fluctuations due to economic uncertainty, geopolitical risks, and trade concerns, highlighting the importance of diversification and following market trends closely.
- [posts_like_dislike id=837]
The era of the crypto bull market appears to be coming to an end, signaling a winter of sustained losses and stagnation, as per insights from Coinbase’s institutional arm. David Duong,...
Read moreThe era of the crypto bull market appears to be coming to an end, signaling a winter of sustained losses and stagnation, as per insights from Coinbase’s institutional arm. David Duong, Coinbase Institutional’s global head of research, mentioned that the 200-day simple moving average (SMA) model indicates that Bitcoin’s recent sharp decline marks the beginning of a bear market cycle since late March. The COIN50 index, which includes the top 50 tokens by market capitalization, has also been consistently trading in bear market territory since the end of February.
Bitcoin slipped below its 200-day SMA on March 9, signaling a long-term shift to bearish momentum. Duong emphasized the challenges of defining a crypto bear market, where corrections of 20% or more are common. Contrarily, a 20% decline is typically used to characterize bear markets in traditional stock markets.
The report argued that the traditional 20% benchmark overlooks the impact of investor sentiment and portfolio adjustments triggered by smaller yet intense sell-offs. Bear markets are seen as fundamental changes in market structure, with deteriorating fundamentals and shrinking liquidity rather than just downward percentage movements.
In addition to the 200-day SMA, Duong highlighted bitcoin’s risk-adjusted performance measured in standard deviations (z-score) as an effective means of identifying crypto bear markets. The current z-score model indicates that the recent bull cycle ended in late February, categorizing subsequent activity as “neutral” and suggesting a need for a defensive risk assessment approach.
As the venture capital (VC) funding in the crypto space slows down, alternative cryptocurrencies may face a harsher winter ahead. While Bitcoin reached new highs this year, VC funding levels remain 50%-60% lower than in 2021-22, indicating a lack of enthusiasm for riskier investments.
Duong predicts that the crypto market may stabilize in mid-to-late 2Q25, paving the way for a better 3Q25.
- [posts_like_dislike id=829]

